Infographics can be helpful. Honestly. Done well, they can present complex and dry data in a way that’s accessible and even entertaining. They can make information quicker to digest, and they can make it easier to identify patterns and trends. Just see our guides to the best infographics and the best infographic makers.
But the medium is often abused. We’ve seen plenty of examples of data being shoehorned into bizarre visual presentations merely for the sake of it, sometimes making it more difficult to interpret than if it had simply been presented in a list. However, the design below could be the worst infographic we’ve seen yet. Attempting to link every wild online conspiracy going into a ‘map’ of incoherence, it succeeds in one thing: showing how ridiculous many conspiracy theories are.
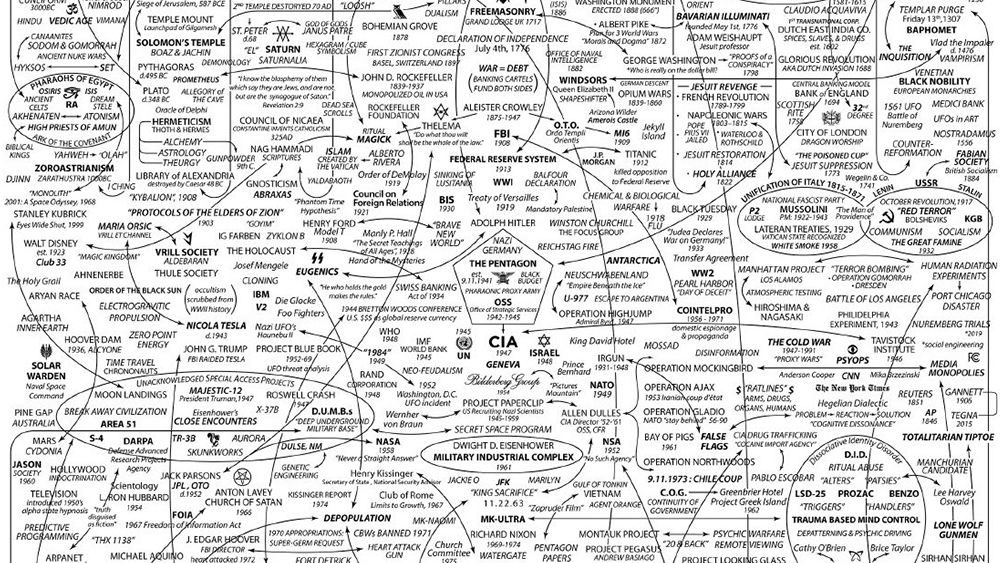
When I first spotted this, I assumed it to be a parody, either of conspiracy theories or of infographics. But a bit of digging reveals that the map is intended to be serious. Its creator, the ‘Deep State Mapping Project’ describes it as a ‘chronological cartography of humanity’s hidden history, from present day to Atlantis. Focused on exposing the declassified history of the CIA in the 20th Century, as well as the Military Industrial Complex.’
An attempt to make it possible to believe various unconnected conspiracy theories are part of one overarching plot was always going to be difficult. The result isn’t really an infographic at all, but a bunch of random names, organisations and events thrown on to a page with no context. ‘Princess Diana’ appears next to ‘Anthrax’, random box outs refer to Egyptian pharaohs and the reunification of Italy.
But perhaps that’s the beauty of it. The design invites the viewer to interpret the clusters of proper nouns how they wish and to create connections where none exists. Why are Nazi Germany and the Pentagon linked with an arrow to the Knights of Malta? No reason, but I’m sure someone will happily make one up. This could make it the ultimate resource for conspiracy theorists.
“How in Gods name did someone create this?” one person asked on X. Others suggested it should be made into a board game. One person provided more constructive criticism: “Hard to read. We need the chronological map.” We really don’t. But believe or not there are more designs, including one about Big Holistic Medicine (the DSMP also flogs crystals and cosmic healing discs – now that sounds like a conspiracy theory).
In true conspiracy theory fashion, there appears to be a claim going around that the infographic and others produced by the same person have been banned. They haven’t, although if crimes against design were really considered to crimes, they surely would be.